
Map the Meal Gap with Feeding America

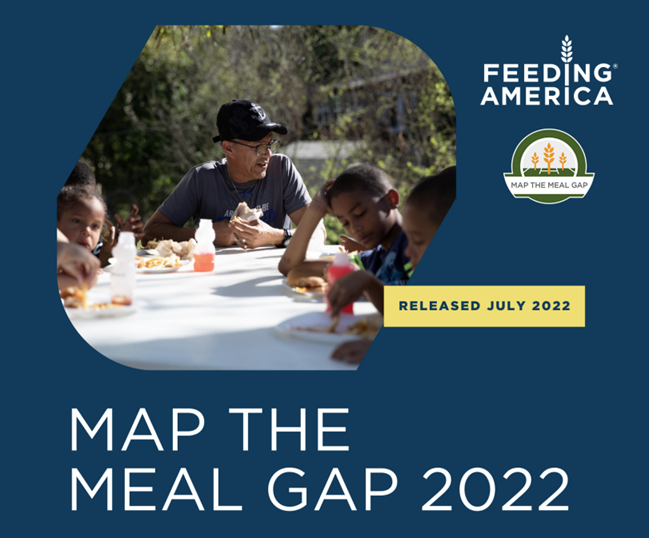
Have you read Feeding America “Map the Meal Gap 2022” report? It’s an eye-opening statistical read that provides updated data on what is happening in our nation when it comes to food insecurity and who is affected.
Feeding America has made the commitment to address these persistent racial inequities, and one piece of this broader effort includes the disaggregation of data by race and ethnicity. For the first time in 2022, this study includes local food insecurity data for several racial and ethnic identities.
Review These Key Findings
1) 100% of counties and congressional districts are home to people facing hunger.
2) Food insecurity among Black or Latino individuals is higher than White individuals in 99 of counties.
3) County food insecurity varies by as much as 45 percentage points within some racial/ethnic groups.
4) Child food insecurity rates are higher than 40% in some counties.
5) 1 in 3 people facing hunger are unlikely to qualify for SNAP (Supplemental Nutrition Assistance Program).
6) People facing hunger report needing $44 more per month to meet their food needs.
7) 8 out of 10 high food insecurity counties are in the South.
8) 9 out of 10 high food insecurity counties are rural.
9) The national average cost per meal was $3.25.
10) County meal costs are estimated to range from $2.19 to $10.61.
You can read the full report here: Map the Meal Gap 2022 Report.pdf (feedingamerica.org)
Use the Map the Meal Gap Tool
Try using the Map the Meal Gap tool to find out more about food insecurity in your area.
Overall (all ages) Hunger & Poverty in the United States | Map the Meal Gap (feedingamerica.org)
Read additional stories from our blog.